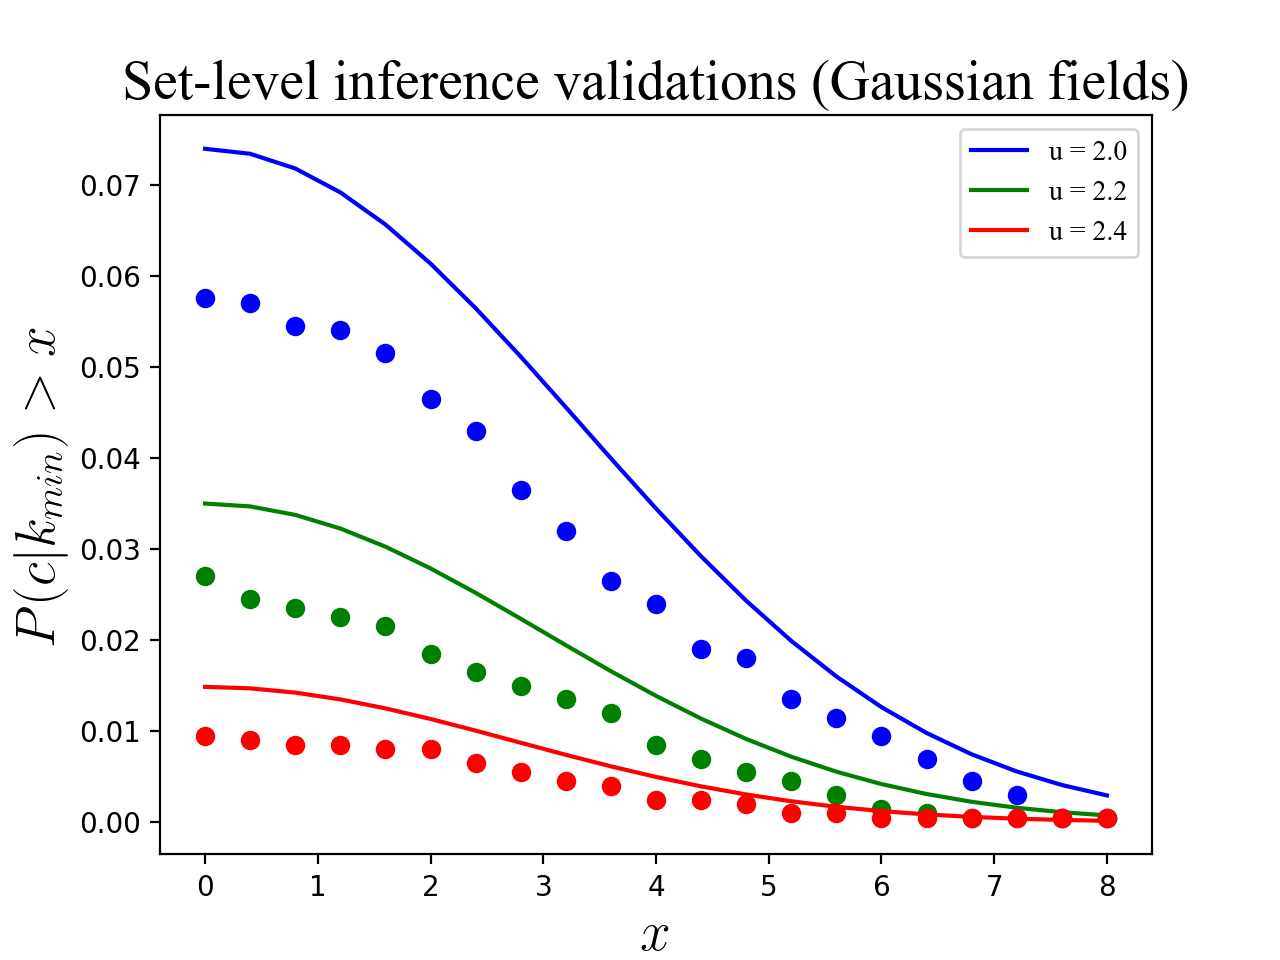
Set-level inference (Gaussian)
Set-level inference refers to the probability that 1D Gaussian fields will produce at least c upcrossings with a minimum extent of k when thresholded at a value u. This probability pertains to the entire excursion set (i.e. all field regions which exceed u). The basic procedure for RFT validations is outlined in Examples/Basic/Validating. Only code details are provided below.
See also ./rft1d/examples/val_upx_0_gauss_set.py
import numpy as np
from matplotlib import pyplot
import rft1d

eps        = np.finfo(float).eps   #smallest float

#(0) Test on one random field:
np.random.seed(0)
nResponses   = 2000
nNodes       = 101
FWHM         = 8.5
interp       = True
wrap         = True
heights      = [2.0, 2.2, 2.4]
c            = 2
### generate data:
y            = rft1d.randn1d(nResponses, nNodes, FWHM)
calc         = rft1d.geom.ClusterMetricCalculator()
rftcalc      = rft1d.prob.RFTCalculator(STAT='Z', nodes=nNodes, FWHM=FWHM)

#(1) Maximum region size:
K0      = np.linspace(eps, 8, 21)
K       = [[calc.cluster_extents(yy, h, interp, wrap)   for yy in y]  for h in heights]
### compute number of upcrossings above a threshold:
C       = np.array([[[  sum([kkk>=k0 for kkk in kk])  for kk in k]  for k in K]   for k0 in K0])
P       = np.mean(C>=c, axis=2).T
P0      = np.array([[rftcalc.p.set(c, k0, h)  for h in heights]  for k0 in K0/FWHM]).T

#(2) Plot results:
pyplot.close('all')
colors  = ['b', 'g', 'r']
ax      = pyplot.axes()
for color,p,p0,u in zip(colors,P,P0,heights):
        ax.plot(K0, p,  'o', color=color)
        ax.plot(K0, p0, '-', color=color, label='u = %.1f'%u)
ax.set_xlabel('$x$', size=20)
ax.set_ylabel('$P(c | k_min) > x$', size=20)
ax.legend()
ax.set_title('Set-level inference validations (Gaussian fields)', size=20)
pyplot.show()
(Source code, png, hires.png, pdf)
Warning
As reported in Friston et al. (1994), RFT tends to predict slightly higher p values than are obtained in simulation. This is not considered a serious limitation because (a) critical RFT thresholds are accurate, and (b) RFT set-level probability values err in the conservative direction.