Scripting landmark warps
Landmark warping can be scripted using the mwarp1d.warp_landmark function.
Let’s first run an example script then consider the details:
In [1]:
%matplotlib inline
In [2]:
import numpy as np
from matplotlib import pyplot as plt
import mwarp1d
#define a plotting function (for re-use below)
def plot_warp_results(y, yw, x0, x1):
plt.figure()
ax = plt.axes()
c0,c1 = 'blue', 'orange'
ax.plot(y, color=c0, label='Original')
ax.plot(yw, color=c1, label='Warped')
[ax.plot(xx, y[xx], 'o', color=c0) for xx in x0]
[ax.plot(xx, yw[xx], 'o', color=c1) for xx in x1]
ax.legend()
ax.set_xlabel('Domain position (%)', size=13)
ax.set_ylabel('Dependent variable value', size=13)
plt.show()
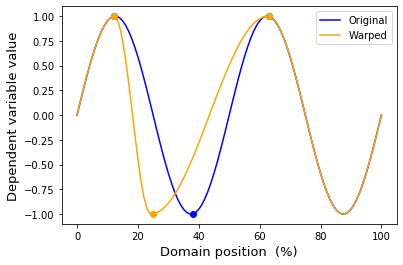
#define landmarks:
Q = 101 #domain size
x0 = [38, 63] #initial landmark location(s)
x1 = [25, 68] #final landmark location(s)
#apply warp:
y = np.sin( np.linspace(0, 4*np.pi, Q) ) #an arbitary 1D observation
yw = mwarp1d.warp_landmark(y, x0, x1) #warped 1D observation
#plot:
plot_warp_results(y, yw, x0, x1)
The input arguments to warp_landmark include:
y — the 1D data to be warped
x0 — initial landmark positions
x1 — final landmark positions
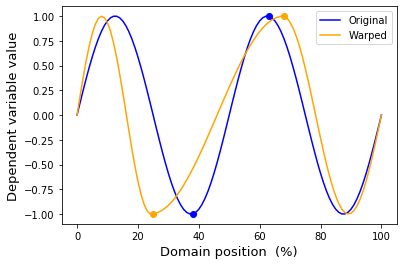
Let’s consider what happens when only a single landmark is specified:
In [3]:
x0   = [38]
x1   = [25]
yw   = mwarp1d.warp_landmark(y, x0, x1)
plot_warp_results(y, yw, x0, x1)
Note that using a single landmark causes the entire domain to be warped.
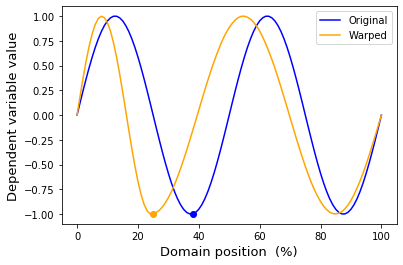
To restrict warping effects to a local area, add more landmarks, like this:
In [4]:
x0   = [12, 38, 63]
x1   = [12, 25, 63]
yw   = mwarp1d.warp_landmark(y, x0, x1)
plot_warp_results(y, yw, x0, x1)