API
(To navigate this page use the menu on the left)
ManualWarp1D
-
class
mwarp1d.ManualWarp1D(Q)¶ A class for constructing constrained nonlinear 1D warps and applying them to univariate and multivariate 1D data.
- Attributes
Q — domain size (integer)
q0 — original domain positions (1D NumpyArray)
amp — warp amplitude (absolute units, DO NOT MODIFY)
center — warp center (absolute units, DO NOT MODIFY)
head — warp head (absolute units, DO NOT MODIFY)
tail — warp tail (absolute units, DO NOT MODIFY)
Properties
- property
ManualWarp1D.amp_r¶Warp amplitude (relative to its maximum possible size)
- property
ManualWarp1D.center_r¶Warp center (relative to its maximum possible size)
- property
ManualWarp1D.head_r¶Warp head (relative to its maximum possible size)
- property
ManualWarp1D.tail_r¶Warp tail (relative to its maximum possible size)
Methods
ManualWarp1D.__init__(Q)¶Initialize warp.
- Args
Q — domain size (integer)
ManualWarp1D.apply_warp(y)¶Apply warp to an arbitrary 1D observation.
- Args
y — a 1D NumPy array (must be same size as warp)
- Returns
Warped y (1D NumPy array)
ManualWarp1D.get_displacement_field()¶Get displacement field corresponding to the current warp parameters.
- Returns
Displacement field (1D NumPy array)
ManualWarp1D.get_warped_domain()¶Get warped domain corresponding to the current warp parameters.
- Returns
Warped domain (1D NumPy array)
ManualWarp1D.reset()¶Reset warp to the null warping field.
- Affects
All warp parameters: “amp”, “center”, “head”, “tail”
ManualWarp1D.set_amp(x, coerce=True)¶Set relative warp amplitude.
- Args
x — relative amplitude (float, -1 to +1)
- Keyword args
coerce — coerce child properties (default: True)
- Affects
Child properties “head” and “tail”
ManualWarp1D.set_center(x)¶Set relative warp center.
- Args
x — relative center (float, 0 to 1, where 0 and 1 represent the first and last continuum points)
- Affects
Child properties “amp”, “head” and “tail”
ManualWarp1D.set_head(x)¶Set relative warp head (i.e., warp kernel’s leading edge)
- Args
x — relative head (float, 0 to 1)
- Affects
(No child properties)
ManualWarp1D.set_tail(x)¶Set relative warp tail (i.e., warp kernel’s trailing edge)
- Args
x — relative tail (float, 0 to 1)
- Affects
(No child properties)
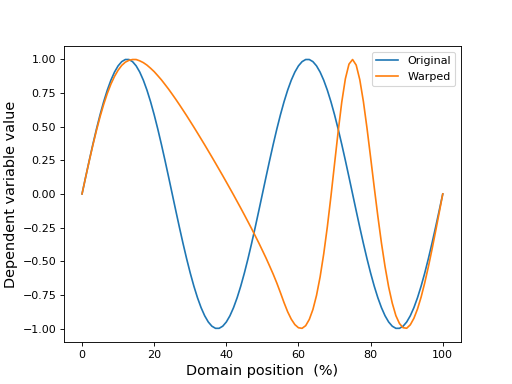
Example
import numpy as np
from matplotlib import pyplot as plt
import mwarp1d

#define warp:
Q    = 101                      #domain size
warp = mwarp1d.ManualWarp1D(Q)  #constrained Gaussian kernel warp object
warp.set_center(0.25)           #relative warp center (0 to 1)
warp.set_amp(0.5)               #relative warp amplitude (-1 to 1)
warp.set_head(0.2)              #relative warp head (0 to 1)
warp.set_tail(0.2)              #relative warp tail (0 to 1)

#apply warp:
y    = np.sin( np.linspace(0, 4*np.pi, Q) )  #an arbitary 1D observation
yw   = warp.apply_warp(y)                    #warped 1D observation

#plot:
plt.figure()
ax = plt.axes()
ax.plot(y, label='Original')
ax.plot(yw, label='Warped')
ax.legend()
ax.set_xlabel('Domain position  (%)', size=13)
ax.set_ylabel('Dependent variable value', size=13)
plt.show()
(Source code, png, hires.png, pdf)
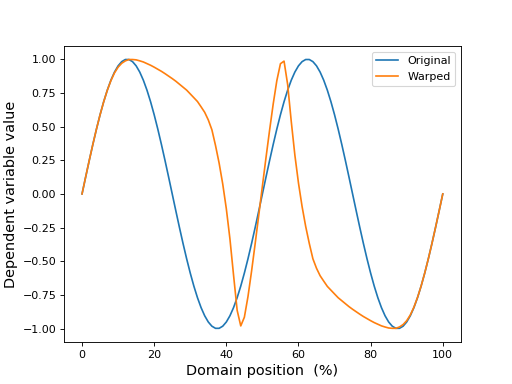
SequentialManualWarp
-
class
mwarp1d.SequentialManualWarp¶ A class for storing applying a sequence of independent manual warps.
- Properties
Q — domain size (integer)
nwarps — number of manual warps in the sequence
Methods -
SequentialManualWarp.append(warp)¶Append a warp to the existing sequence.
- Args
warp — a ManualWarp1D instance
SequentialManualWarp.apply_warp_sequence(y)¶Apply all warps sequentially.
- Args
y — a 1D numpy array (must be same size as the warps in the warp sequence)
- Returns
warped 1D data (numpy array)
SequentialManualWarp.reset()¶Reset the warp sequence (remove all warps)
Example -
import numpy as np
from matplotlib import pyplot as plt
import mwarp1d


#define first warp:
Q     = 101                      #domain size
warp0 = mwarp1d.ManualWarp1D(Q)  #constrained Gaussian kernel warp object
warp0.set_center(0.10)           #relative warp center (0 to 1)
warp0.set_amp(0.3)               #relative warp amplitude (-1 to 1)
warp0.set_head(0.0)              #relative warp head (0 to 1)
warp0.set_tail(0.0)              #relative warp tail (0 to 1)

#define second warp:
warp1 = mwarp1d.ManualWarp1D(Q)
warp1.set_center(0.90)
warp1.set_amp(-0.3)
warp1.set_head(0.0)
warp1.set_tail(0.0)

#create and apply sequential warps
seq   = mwarp1d.SequentialManualWarp()
seq.append( warp0 )
seq.append( warp1 )
y     = np.sin( np.linspace(0, 4*np.pi, Q) )  #an arbitary 1D observation
yw    = seq.apply_warp_sequence(y)            #sequentially warped 1D observation

#plot:
plt.figure()
ax = plt.axes()
ax.plot(y, label='Original')
ax.plot(yw, label='Warped')
ax.legend()
ax.set_xlabel('Domain position  (%)', size=13)
ax.set_ylabel('Dependent variable value', size=13)
plt.show()
(Source code, png, hires.png, pdf)
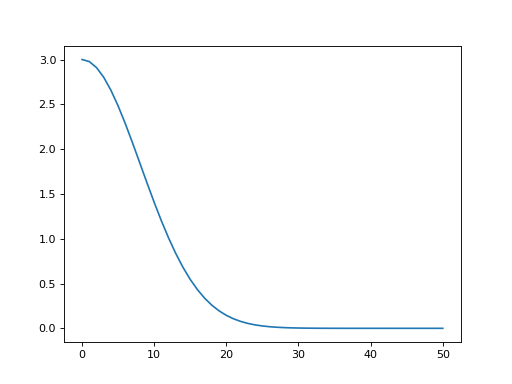
gaussian_half_kernel
-
mwarp1d.gaussian_half_kernel(r, amp, n, reverse=False)¶ Create left half of a Gaussian kernel.
- Args
r — kernel width (relative to n)
amp — kernel height
n — number of nodes used to represent the kernel
- Keyword args
reverse — set to True to return kernel’s right half (default False)
- Returns
n-element NumPy array containing Gaussian half kernel
- Example
>>> from matplotlib import pyplot as plt
>>> import mwarp1d
>>>
>>> k = mwarp1d.gaussian_half_kernel(10, 3, 51, reverse=True)
>>>
>>> plt.figure()
>>> plt.plot(k)
>>> plt.show()
(Source code, png, hires.png, pdf)

interp1d
-
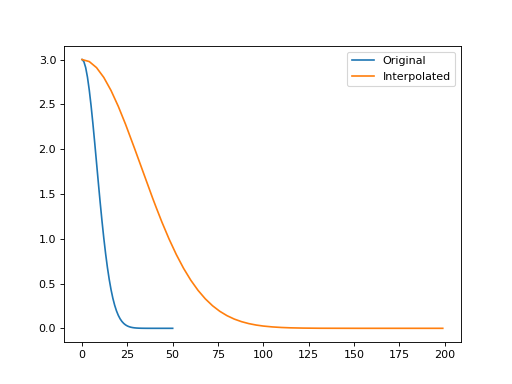
mwarp1d.interp1d(y, n=101, dtype=None, kind='linear', axis=-1, copy=True, bounds_error=True, fill_value=nan)¶ Interpolate to a fixed number of points
- Args
y — original 1D data (NumPy array)
- Keyword args
n — number of nodes in the interpolated vector (integer)
other arguments — see documentation for scipy.interpolate.interp1d
- Returns
n-element NumPy array containing Gaussian half kernel
- Example
>>> from matplotlib import pyplot as plt
>>> import mwarp1d
>>>
>>> k = mwarp1d.gaussian_half_kernel(10, 3, 51, reverse=True)
>>> ki = mwarp1d.interp1d(k, 200)
>>>
>>> plt.figure()
>>> plt.plot(k, label='Original')
>>> plt.plot(ki, label='Interpolated')
>>> plt.legend()
>>> plt.show()
(Source code, png, hires.png, pdf)
launch_gui
-
mwarp1d.launch_gui(*args)¶ Command-line access to GUI launching.
This function allows the user to bypass the initial GUI screen and proceed directly to the specified warping interface, thereby avoiding manual GUI setup. It also allows you to resume previous mwarp1d sessions.
This function can be called from both Python and interactive Python. The GUI will be launched as a subprocess of the active Python kernel.
- Args
data — a 2D numpy array (rows = observations, columns = domain nodes)
fnameCSV — CSV file name containing a 2D array (rows = observations, columns = domain nodes)
fnameNPZ — NPZ file name (zipped numpy format) containing mwarp1d results (existing or to be written)
mode — “landmark” or “manual”
- Arg options
launch_gui() #launch new session with no data
launch_gui( fnameNPZ ) #resume previous session using an existing mwarp1d results file
launch_gui( fnameCSV ) #launch new session using data from CSV file
launch_gui( fnameCSV , mode ) #launch new session with CSV data in specified mode
launch_gui( fnameCSV , mode , fnameNPZ ) #launch new session with CSV data in specified mode, with results saved to fnameNPZ
loadnpz
-
mwarp1d.loadnpz(fname)¶ Load mwarp1d compressed numpy (NPZ) file for results parsing.
- Args
fname — the NPZ file name
- Example
>>> import numpy as np
>>> from matplotlib import pyplot as plt
>>>
>>> with np.load(fnameNPZ) as Z:
>>>     print( Z['mode'] )
>>>     print( Z['ydata_template'].shape )
>>>     print( Z['ydata_sources'].shape )
>>>     print( Z['ydata_sources_warped'].shape )
>>>
>>>     y = Z['ydata_sources']
>>>
>>> plt.figure()
>>> plt.plot( y.T )
>>> plt.show()
- See also
warp_landmark
-
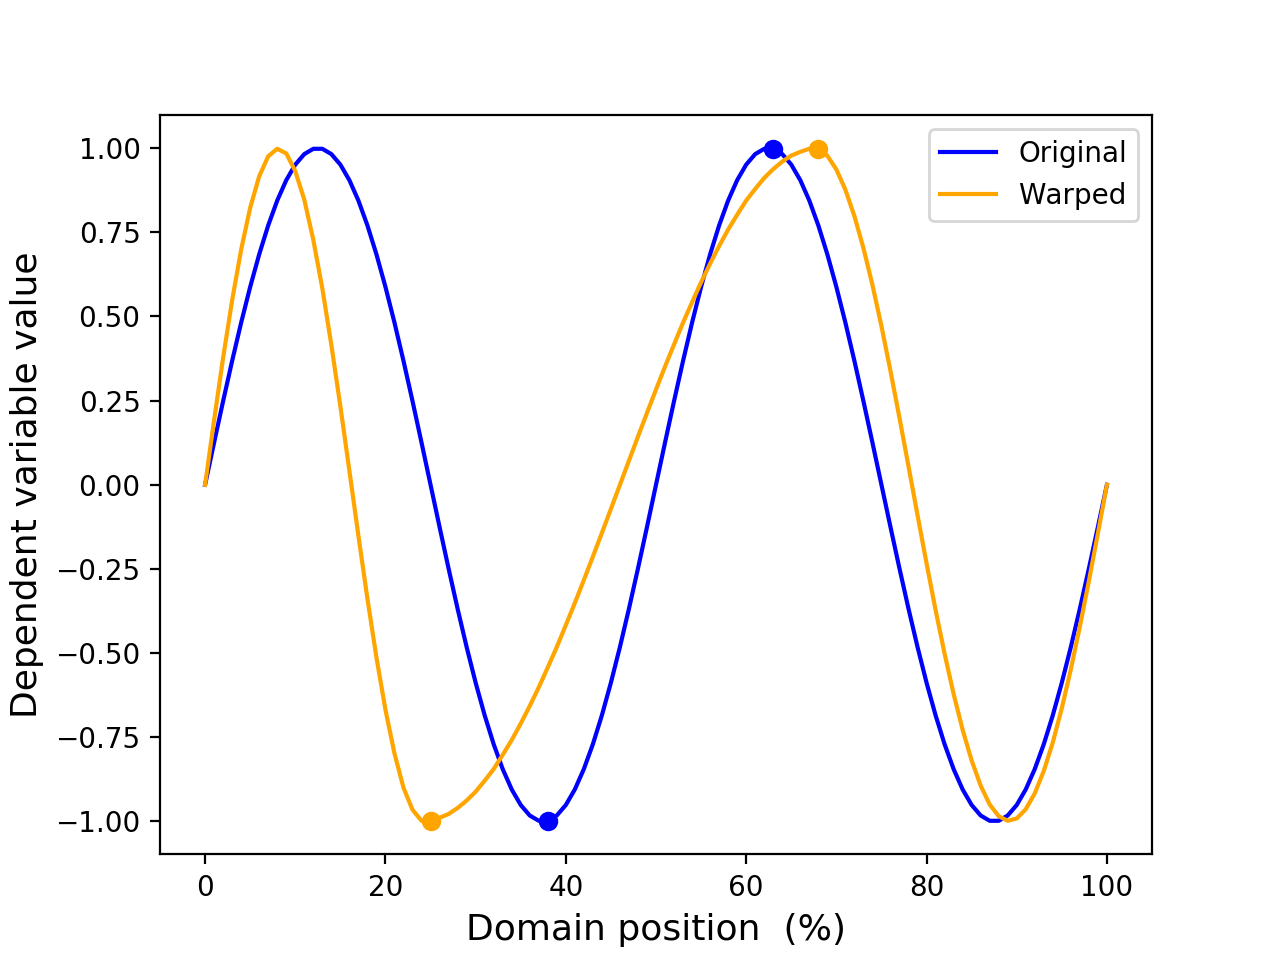
mwarp1d.warp_landmark(y, x0, x1, **kwdargs)¶ Warp 1D data using landmarks. Default: piecewise linear interpolation between landmarks.
Landmarks must be specified as integers and must lie at least two nodes from the endpoints. For example, if the domain has 100 nodes, then the minimum and maximum landmark positions are 2 and 97, respectively. (i.e., 0+2 and 99-2)
- Args
y — original 1D data (NumPy array)
x0 — original landmark locations (list or array of integers, monotonically increasing)
x1 — new landmark locations (list or array of integers, monotonically increasing)
- Keyword args
(See documentation for scipy.interpolate.interp1d)
- Example
>>> import numpy as np
>>> from matplotlib import pyplot as plt
>>> import mwarp1d
>>>
>>> #define landmarks:
>>> Q    = 101            #domain size
>>> x0   = [38, 63]       #initial landmark location(s)
>>> x1   = [25, 68]       #final landmark location(s)
>>>
>>> #apply warp:
>>> y    = np.sin( np.linspace(0, 4*np.pi, Q) )  #an arbitary 1D observation
>>> yw   = mwarp1d.warp_landmark(y, x0, x1)   #warped 1D observation
>>>
>>> #plot:
>>> plt.figure()
>>> ax = plt.axes()
>>> c0,c1 = 'blue', 'orange'
>>> ax.plot(y,  color=c0, label='Original')
>>> ax.plot(yw, color=c1, label='Warped')
>>> [ax.plot(xx, y[xx],  'o', color=c0)  for xx in x0]
>>> [ax.plot(xx, yw[xx], 'o', color=c1)    for xx in x1]
>>> ax.legend()
>>> ax.set_xlabel('Domain position  (%)', size=13)
>>> ax.set_ylabel('Dependent variable value', size=13)
>>> plt.show()
(Source code, png, hires.png, pdf)

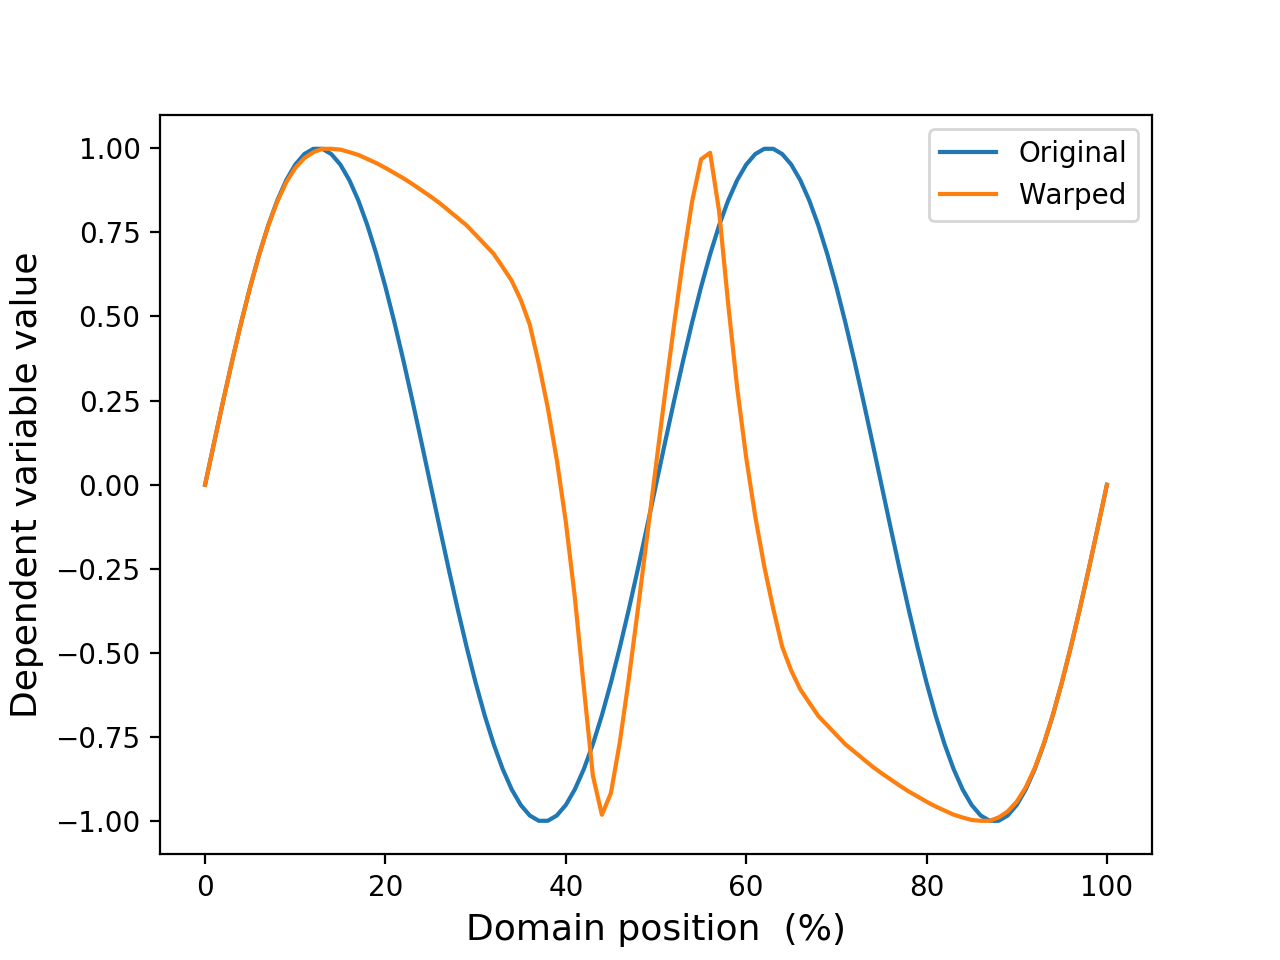
warp_manual
-
mwarp1d.warp_manual(y, center, amp, head=0.2, tail=0.2)¶ Warp 1D data using landmarks. Default: piecewise linear interpolation between landmarks.
Landmarks must be specified as integers and must lie at least two nodes from the endpoints. For example, if the domain has 100 nodes, then the minimum and maximum landmark positions are 2 and 97, respectively. (i.e., 0+2 and 99-2)
- Args
y — original 1D data (NumPy array)
center — warp kernel center, relative to its feasible range (between 0 and 1)
amp — warp kernel amplitude, relative to its feasible range (between -1 and 1)
- Keyword args
head — warp kernel head width, relative to its feasible range (between 0 and 1)
tail — warp kernel tail width, relative to its feasible range (between 0 and 1)
- Example
>>> from matplotlib import pyplot as plt
>>> import mwarp1d
>>>
>>> #define warp:
>>> Q      = 101
>>> center = 0.25
>>> amp    = 0.5
>>> head   = 0.2
>>> tail   = 0.2
>>>
>>> #apply warp:
>>> y    = np.sin( np.linspace(0, 4*np.pi, Q) )  #an arbitary 1D observation
>>> yw   = mwarp1d.warp_manual(y, center, amp, head, tail) #warped 1D observation
>>>
>>> #plot:
>>> plt.figure()
>>> ax = plt.axes()
>>> ax.plot(y, label='Original')
>>> ax.plot(yw, label='Warped')
>>> ax.legend()
>>> ax.set_xlabel('Domain position  (%)', size=13)
>>> ax.set_ylabel('Dependent variable value', size=13)
>>> plt.show()
(Source code, png, hires.png, pdf)
